Article
Reporting ESG to investors and banks: what they really look for in your report
A risk analyst spends between ten and twenty minutes on a sustainability report. They do not read it: they scan it for four or five specific things. If they cannot find them quickly, they do not conclude that the company is performing poorly. They conclude that they cannot assess it, which is worse in practical terms.
That is this guide's starting point. It is not about writing a prettier sustainability report, but about what the people providing money —banks, funds and rating agencies— actually look for, and why most reports fail on things unrelated to the company's environmental performance.
What has changed at the analyst's desk
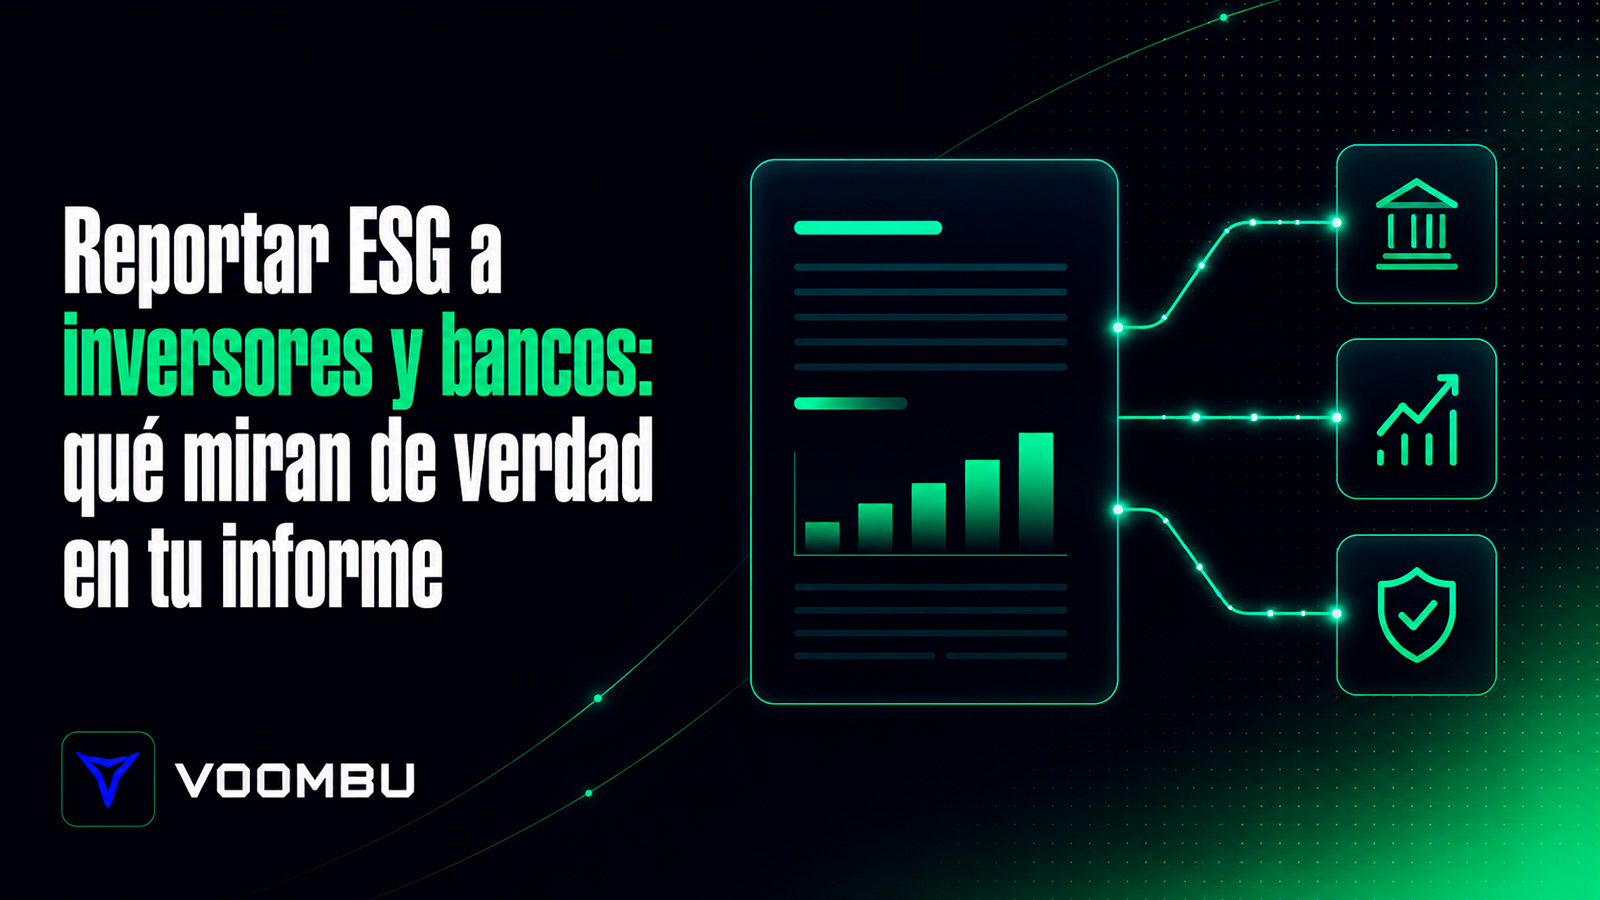
For years, sustainability information was read by investor relations or reputation departments. Now it is read by the risk department. And those people have different habits.A credit analyst does not assess intentions. They assess whether data is verifiable, whether the series is comparable with the previous year's and whether the calculation method is explained. They have spent twenty years doing the same with financial statements, and apply the same scepticism.
That explains a common frustration: companies that have genuinely reduced emissions receive mediocre assessments. It is almost never about performance. It is because data cannot be traced, the methodology changed between financial years without explanation, or 60% of the figures are estimates not identified as such.
Financial materiality: the filter almost nobody applies properly
Of everything a company can say about its sustainability, an investor is interested in a small fraction: what affects the balance sheet or risk profile.The distinction is uncomfortable, but that is how it works. The corporate volunteering programme may be excellent without appearing in any valuation model. The energy certification of warehouses pledged as security, however, feeds directly into collateral valuation.
A report devoting twelve pages to the former and half a page to the latter is optimised for the wrong audience. That is exactly what happens in most published reports.
The three foundations of a credible report
How it is calculated. Which emission factors are used, their year and what happens when information is missing. This is the most frequently omitted section and the one carrying the most weight: disclosing uncertainty inspires more confidence than a round number without explanation. An experienced analyst distrusts false precision.What it is compared against. The European Taxonomy provides a common reference: what percentage of CapEx and OpEx corresponds to aligned activities. This is not an image exercise; it enables comparison between two companies in the same sector without translation.
Who has reviewed it. If non-financial information undergoes no internal control equivalent to accounting controls, the analyst will apply an uncertainty discount. Not because they suspect bad faith, but because they have no way of knowing.
Frameworks: less important than they seem, but you need to know them
There is an obsession with choosing the right framework that is usually a waste of time. Frameworks are output formats. What matters is the underlying data.That said, it helps to understand the landscape. ESRS is the mandatory standard in the European Union under CSRD. Following the Omnibus package, mandatory scope was substantially reduced: thresholds rose to more than 1,000 employees and over 450 million in turnover, and subsequent company waves were delayed. Many medium-sized companies preparing for compliance discovered they were no longer in scope. VSME is the voluntary standard for companies outside that scope, adopted by the European Commission in July 2026. It is proportionate, much lighter, and is the format referenced by both banking regulation and official Spanish tools. GRI remains useful for communicating with a broad stakeholder audience. CDP is the benchmark for climate transparency, and many large clients explicitly request it. Neither has disappeared with the arrival of ESRS.
The mistake is not choosing the wrong one. The mistake is treating them as separate projects, each with its own data collection, spreadsheet and deadline. A plant's natural gas consumption is a single data point: it must feed ESRS E1, the CDP questionnaire and the GRI indicator without anybody requesting it again.
XBRL and why a PDF is no longer enough
XBRL tagging turns every figure in the report into a machine-identifiable data point. It sounds like an administrative technicality, but has a practical consequence: without it, information sits outside the automated processes major asset managers use to screen thousands of companies.It underpins the European Single Access Point, the database investors will search. A PDF report remains useful for a person to read. It does not allow an algorithm to find it.
The reader almost nobody discusses: the bank
Here is the most significant change of recent months, and the one appearing least often in investor-reporting guides.When people talk about "reporting to investors", they usually mean funds, asset managers and rating agencies. For most medium-sized European companies, however, the reader with the greatest consequences is someone else: their bank.
Europe has two independent regulatory blocks. Corporate reporting rules —CSRD, ESRS, VSME— define who must report, and have been relaxed. Banking rules have not.
The EBA/GL/2025/01 guidelines, applicable from January 2026 for most institutions and January 2027 for small and non-complex institutions, require banks to assess the ESG risk of every company they finance, integrate it into credit origination and review, and request the information needed to do so.
They contain a detail with direct consequences: when a client does not provide data, the rules allow estimates using sector averages, although they require this practice to diminish as available information improves.
In other words: not responding is not neutral. It means accepting the sector's average score, which rarely favours companies doing things well.
The fact that the Consejo de Finanzas Sostenibles, under the Ministry of Economy, launched a free tool —Eco-Track— in February 2026 to help SMEs provide this information to their banks gives an idea of where things are heading.
From Excel to a system: why this is not a software question
The easy argument against spreadsheets is that they produce errors. True, but that is not the main problem, as anyone who has worked this way for years knows: a well-built Excel spreadsheet calculates perfectly.The real problems are three others. There is no trail. When a verifier asks where a particular figure comes from and the answer involves opening four files and calling somebody who no longer works at the company, the information is not defensible. Not because it is false, but because it cannot be demonstrated. There is no continuity. The following year, data collection starts again from scratch. That cost recurs every financial year and never appears in a budget, because it is paid in hours of people who had other things to do. There is no scale. One report for one company is manageable. Fifteen different clients, each with their own sources and deadlines, are not.
Scope 3: where serious reports stand apart
Scope 3 —value-chain emissions— is where the most reports lose credibility. Not because of technical difficulty, but because of methodology.There are two ways to calculate it. Spend-based: take the amount spent in a category and apply an average emission factor. It is quick, acceptable as a starting point, and every analyst knows it is a rough approximation. Activity-based: use actual physical data —tonnes transported, kilowatts consumed, kilometres travelled—. It requires more work and is the only approach that withstands serious scrutiny.
What a verifier will not forgive is not using the spend-based method. It is using it without saying so. A report stating which categories are activity-based and which are estimated is honest. One presenting a single figure without a breakdown invites rejection of the whole number.
How to prepare a report that withstands verification
There are no shortcuts, but there is a sequence that works. Define before collecting. Exactly what each indicator means, its unit, boundary and accountable owner. It sounds bureaucratic and saves half the subsequent work: most discrepancies between departments are not calculation errors, but different definitions of the same concept. Label each data point's status. Measured, calculated from other data, estimated, or not applicable with justification. This distinction separates a defensible report from a list of figures. And it produces the indicator carrying the most weight with a bank: coverage, meaning the percentage of information supported by actual data. Validate before the verifier arrives. Compare against the previous financial year and review any variation above 20 or 30% without a written explanation. It is almost always a unit or boundary error, and finding it internally is inexpensive. Keep evidence attached to the data. Not in a shared folder: linked to the specific figure. The difference in audit time between the two approaches is considerable.Then comes the part almost nobody prepares for
Publishing the report does not close the process. It opens it.Then come the questions: an institution's analyst wants to know why Scope 2 fell by 18%, whether through actual reductions or a change in electricity mix. The rating agency asks about the methodology for a particular social indicator. A large client requests a site-level breakdown.
A company that can answer within two days conveys control. One needing three weeks and a rebuilt spreadsheet conveys the opposite, however good its performance.
What this means in money
Precision matters here, because this is where exaggeration is most common.There are three channels through which sustainability information affects financing terms, and they carry different weights. Sustainability-linked loans adjust the lending margin according to target achievement. The range observed in the European market is typically 5 to 15 basis points. It is real, but concentrated in large, syndicated transactions; it rarely appears in a three-million bilateral loan. The internal rating is the channel that does reach medium-sized companies. The ESG profile acts as a modifier in risk classification, which feeds into adjusted pricing. It is not experienced as a green discount, but as moving one rung up the pricing grid. Collateral valuation is the most direct channel. A property's energy certification and physical risk exposure affect its value, which affects LTV and the amount granted.
And there is a fourth effect that matters more to many companies than the previous three: whether the transaction goes ahead, and how quickly. For a CFO facing an approaching maturity, that is worth more than fifteen basis points.
What cannot be claimed is that a good report guarantees better terms. It depends on the institution, product and transaction. What can be stated is that an absence of verifiable data translates into conservative estimates.
Where Voombu fits
Voombu is the layer where that data lives: captured once, with its source, date and accountable owner, and mapped to whichever frameworks are needed —ESRS, GRI, CDP, GHG Protocol, VSME and the rest— without collecting it again for each one. Outputs include Word, PDF and XBRL.Two further elements are built on the same foundation: a risk map under COSO ERM methodology, distinguishing inherent from residual risk, and an ESG Score with explicit weights for each pillar.
The limits should be clear. Voombu does not audit or issue ratings. It prepares information for third-party verification, which is a different function. Nor does it replace professional judgement: deciding what is material, what lies outside scope and how to assess a control that exists but is not formalised are decisions no tool makes.
What it resolves is making that judgement live outside spreadsheets, repeatable every financial year and demonstrable.
Three ideas to take away
The report is not the work. The work is the infrastructure enabling you to produce it every year without starting over. A report can be produced in three intensive weeks; a system supporting it is something else, and that makes the difference from the second financial year onwards. Methodological honesty beats apparent precision. Declaring what is measured, what is estimated and what could not be calculated inspires more confidence than a round number without explanation. Disclosed gaps can be managed; silent ones generate qualifications. And those who do not provide data are still assessed. They are simply assessed using a sector average. The choice is not between reporting and not reporting: it is between presenting your actual profile and accepting your sector's.Frequently asked questions
What is the difference between an ESG report and the EINF? The Estado de Información No Financiera is the Spanish legal obligation arising from Ley 11/2018, which remains in force. An ESG report is a broader document aimed at capital markets, prioritising financial materiality: how environmental and social factors affect company valuation. Under ESRS, the two converge for companies subject to the requirements.Is ESRS reporting mandatory in 2026? Only for companies exceeding the post-Omnibus thresholds: more than 1,000 employees and over 450 million in turnover. Companies below them can use the voluntary VSME standard. But leaving mandatory scope does not eliminate requests arriving through other channels: banks, clients subject to the directive and financing programmes.
Does a good report really reduce the interest rate? It can influence it through three channels: sustainability-linked loans, with adjustments typically ranging between 5 and 15 basis points in the European market; the institution's internal rating; and collateral valuation. The specific effect depends on the institution, product and transaction, so be wary of anyone promising a fixed figure.
How is Scope 3 calculated auditably? By moving from spend-based to activity-based models wherever possible, with up-to-date emission factors and identified sources. Investment portfolios use specific methodologies such as PCAF. What makes the calculation auditable is not precision: it is being able to break it down and disclose where estimates are used.
What is XBRL, and why do regulators request it? It is tagging that makes every report figure machine-readable. Regulators require it to feed the European Single Access Point, where investors will be able to filter thousands of companies automatically. Without tagging, information remains outside those analytical workflows.
Which indicators do institutional investors examine most closely? Those that can be compared across companies in the same sector and projected over time: carbon footprint across all three scopes, energy intensity, water stress exposure and Taxonomy alignment. In governance, board composition, internal controls and litigation. Governance factors, although generating fewer headlines, have historically been the best predictors of problems.
How does software affect the audit process? It reduces the time the verifier spends checking data origins, because evidence is linked to each figure rather than scattered. It does not guarantee an unqualified report —that depends on the content— but eliminates qualifications caused by missing documentary trails, which are the most frequent and most avoidable.
What if I am a consultancy managing several clients? The problem changes in nature: it is not about producing one good report, but fifteen without the team spending its time chasing data by email. At that point, infrastructure stops being a convenience and becomes the condition for scaling the practice without hiring more people.