
Article
Operational ESG risk management platforms: trends and control in 2026
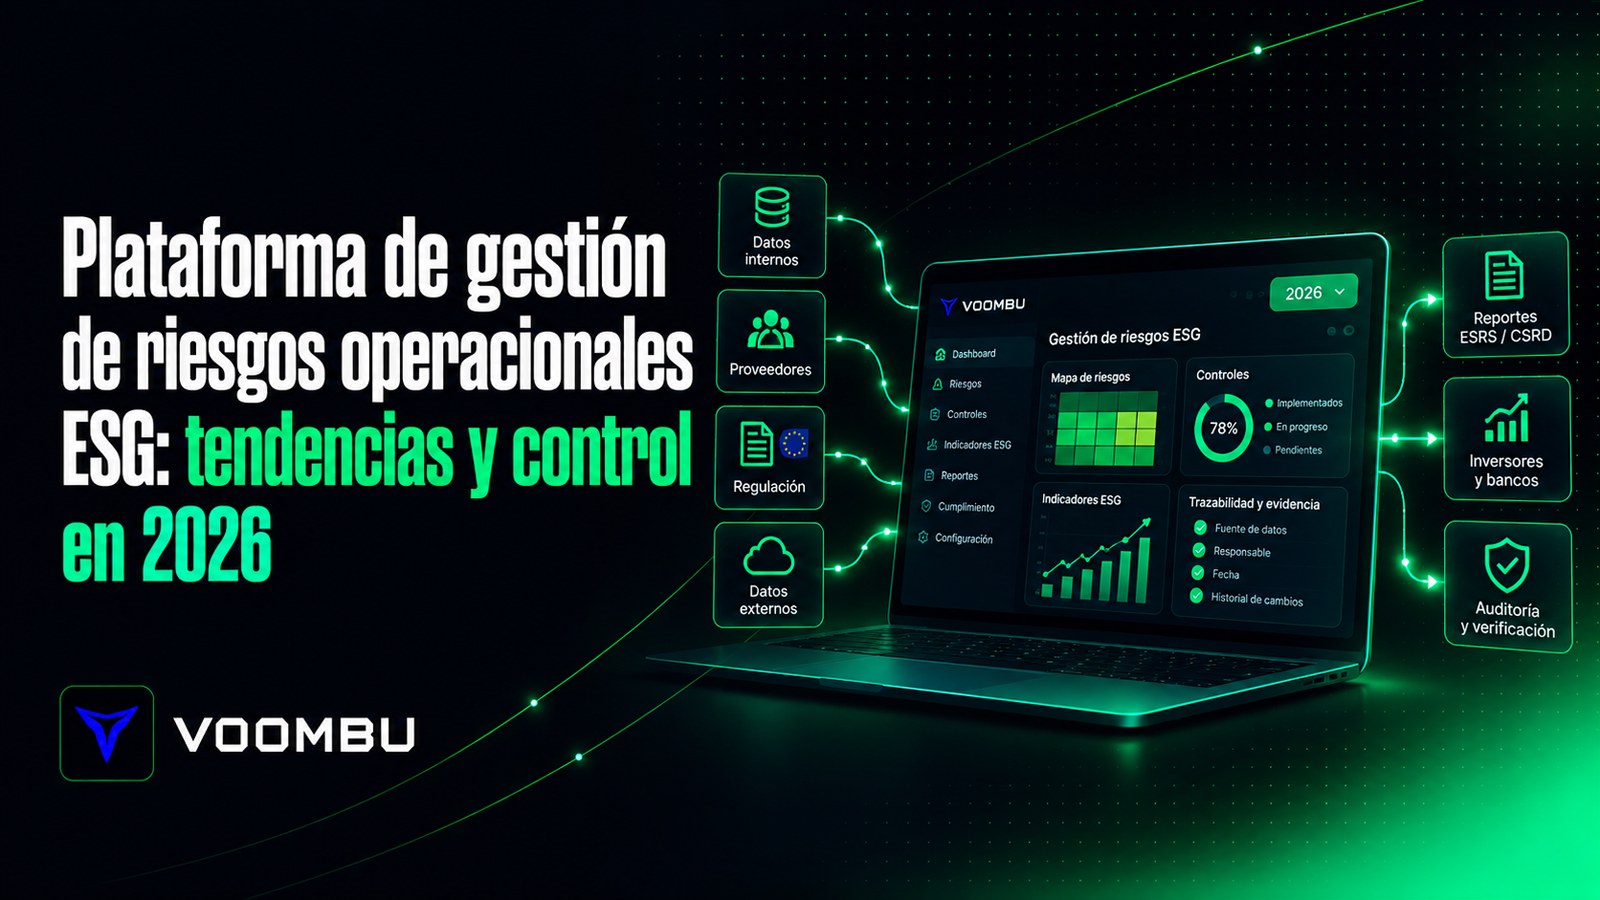
There is a familiar scene in many mid-sized companies: weeks before an audit, someone opens eight spreadsheets containing different versions of the same data and starts reconstructing, email by email, where each figure came from. This is not a problem of willingness or knowledge. It is an infrastructure problem: operational risk and ESG data are still managed using tools that were not designed to withstand a verifier's question — where does this number come from, on what basis, and who approved it?
In 2026, that question is no longer rhetorical. CSRD requires the same rigour for non-financial information as for financial information, banks translate the borrower's ESG profile into their terms, and an operational ESG risk management platform has gone from being a nice-to-have to making the difference between defensible data and data that falls apart at the first verification. In this article, we review what has changed, why spreadsheets have fallen short, how the COSO ERM framework fits into all this and what to examine if you are considering making the move.
From qualitative compliance to data infrastructure
For years, sustainability-related operational risk was dealt with through statements of intent in the annual report. That is over. The European directive has raised the bar: non-financial data needs traceability, version control and evidence, just like an accounting entry. And not only because of the regulator — banking supervisors (the EBA has been tightening climate-risk transparency requirements for some time) and large customers themselves require granular data to feed their scenario models.The practical consequence is that scattered ESG data penalises a company twice: first in working hours, then in the cost of capital, because a risk profile that cannot be demonstrated deteriorates by itself. The answer is not another report: it is an architecture in which every indicator has a source, an owner and a date from the moment it is captured.
Why Excel is no longer a viable option
Not because it is a bad tool — we have all relied on it — but because it leaves no trail. A spreadsheet does not record who changed a value, when or on what basis, and in sensitive calculations such as Scope 3 of the carbon footprint, an undetected manual error can end in an accusation of greenwashing. Furthermore, every change in the regulatory framework requires manual remapping. What was inconvenient across two frameworks becomes unmanageable across sixteen.COSO ERM and ESG: the same risk map, not an appendix
The clearest trend in 2026 is methodological rather than technological: ESG risks are leaving their separate documents and joining the corporate risk map already used by the executive committee. COSO ERM is the natural bridge — the same language of inherent risk, controls and residual risk already familiar to the CFO and internal audit, applied to climate, social and governance events.Two things are needed for that integration to work. The first is technical indicators rather than perceptions: a scale of 1 to 5 completed from memory will not withstand an external review; a control with its policy, action, owner and result will. The second is an honest distinction between inherent risk (arising from your sector and geography) and residual risk (what remains after your controls) — and acceptance that residual risk never falls to zero. In sectors with physical assets, such as real estate, this connection is literal: a building's flood risk ends up in its asset valuation and insurance premium, not in a paragraph of the report.
Anyone wishing to explore how we address this mapping can look at Voombu's ESG risk module, which applies this dual-layer logic — business and ESG risks running on the same COSO ERM engine.
The hidden cost of manual management
We call the bill for manual management operational debt, and it is paid in three instalments. The first is time: chasing data, validating cells and reconciling versions consumes weeks of skilled employees' time that should be spent analysing rather than transcribing. The second is error: every re-entry creates an opportunity for inconsistency, and an inconsistency in regulatory mapping can invalidate entire chapters of an ESRS report. The third is the worst: opportunity — while the team reconstructs data, nobody is managing risk.Properly understood, automation does not replace judgement: it protects it. Automated workflows capture data at source together with its evidence, AI flags anomalies for human review, and traceability builds itself along the way — from source data to the XBRL file required by European digital reporting, without manual conversion processes at the end.
Scalability for the mid-market
An important consideration for European mid-sized companies: regulatory pressure resembles that faced by a large corporation, but resources do not. The answer is not oversized enterprise software requiring six months of implementation, but three simple criteria: managing multiple frameworks (GRI, CDP, CSRD/ESRS, the voluntary VSME standard) from a single data entry; applying the principle of one data point, every framework to avoid duplicate work; and producing audit-ready documentation without additional administrative effort.How to establish audit-ready data governance
If you are starting out, the path is less mysterious than it appears, but it requires an orderly approach.First, the assessment. Before choosing a tool, evaluate the maturity of your current data: what you have for Scopes 1, 2 and 3, where the gaps are against applicable requirements, and who currently owns each data point — if anyone does. Finding the gaps before the auditor does costs much less than fixing them under pressure.
Second, the risk matrix with thresholds. Every key indicator needs a defined tolerance: if emissions or accident rates deviate from the target, the system warns you in time to take corrective action, not at year-end. That view must reach the executive committee's dashboard, because a risk unseen by the decision-maker is an unmanaged risk.
Third, traceability as a habit rather than a project: data owners, validation at capture and an immutable change log. This is the difference between preparing an audit in weeks and preparing it in hours. Our ESG data governance platform is designed to centralise all of this without duplicating effort.
What Voombu contributes: technical control and the cost of capital
Voombu is infrastructure, not a visualisation tool. Data is entered once — with its source, factor, owner and date — and the mapping engine projects it into the frameworks you need, from ESRS and GRI to CDP, with outputs in editable Word, PDF and XBRL. The ESG Score is calculated from that same data using transparent weighting (40 % environmental, 35 % social, 25 % governance), aligned with the logic of rating agencies and adapted to the mid-market.Why does the score matter? Because demonstrable ESG performance is already translating into financing terms: in green and sustainability-linked loans, auditable data can mean a difference of between 5 and 15 basis points in the cost of capital, depending on the bracket. This is not a marketing promise — it is the logical consequence of the lender perceiving less uncertainty.
And a clarification we like to make early: Voombu does not audit or certify. We prepare the data for verification by an independent third party, and that independence is precisely what gives the result its value. The data belongs to the customer, not the platform.
The real estate sector example
This architecture makes the greatest difference in sectors where risk resides in physical assets. A fund with thirty employees may manage two hundred buildings: energy consumption, certifications, physical and transition climate risks — all at asset level, aggregated at fund level, under the European taxonomy and standards such as GRESB. This is the kind of complexity a generic tool built around employee numbers simply cannot address.Turn compliance into profitability
The conclusion for 2026 fits into one sentence: compliance that merely complies is a cost; compliance supported by traceable infrastructure becomes access to capital, customers who approve you as a supplier and better-informed decisions. If your team is still losing weeks reconstructing data that should have been captured correctly the first time, the problem is not the team. Request a Voombu demo and test it with your own data: in 30 minutes, you will know which frameworks apply to you and where to begin.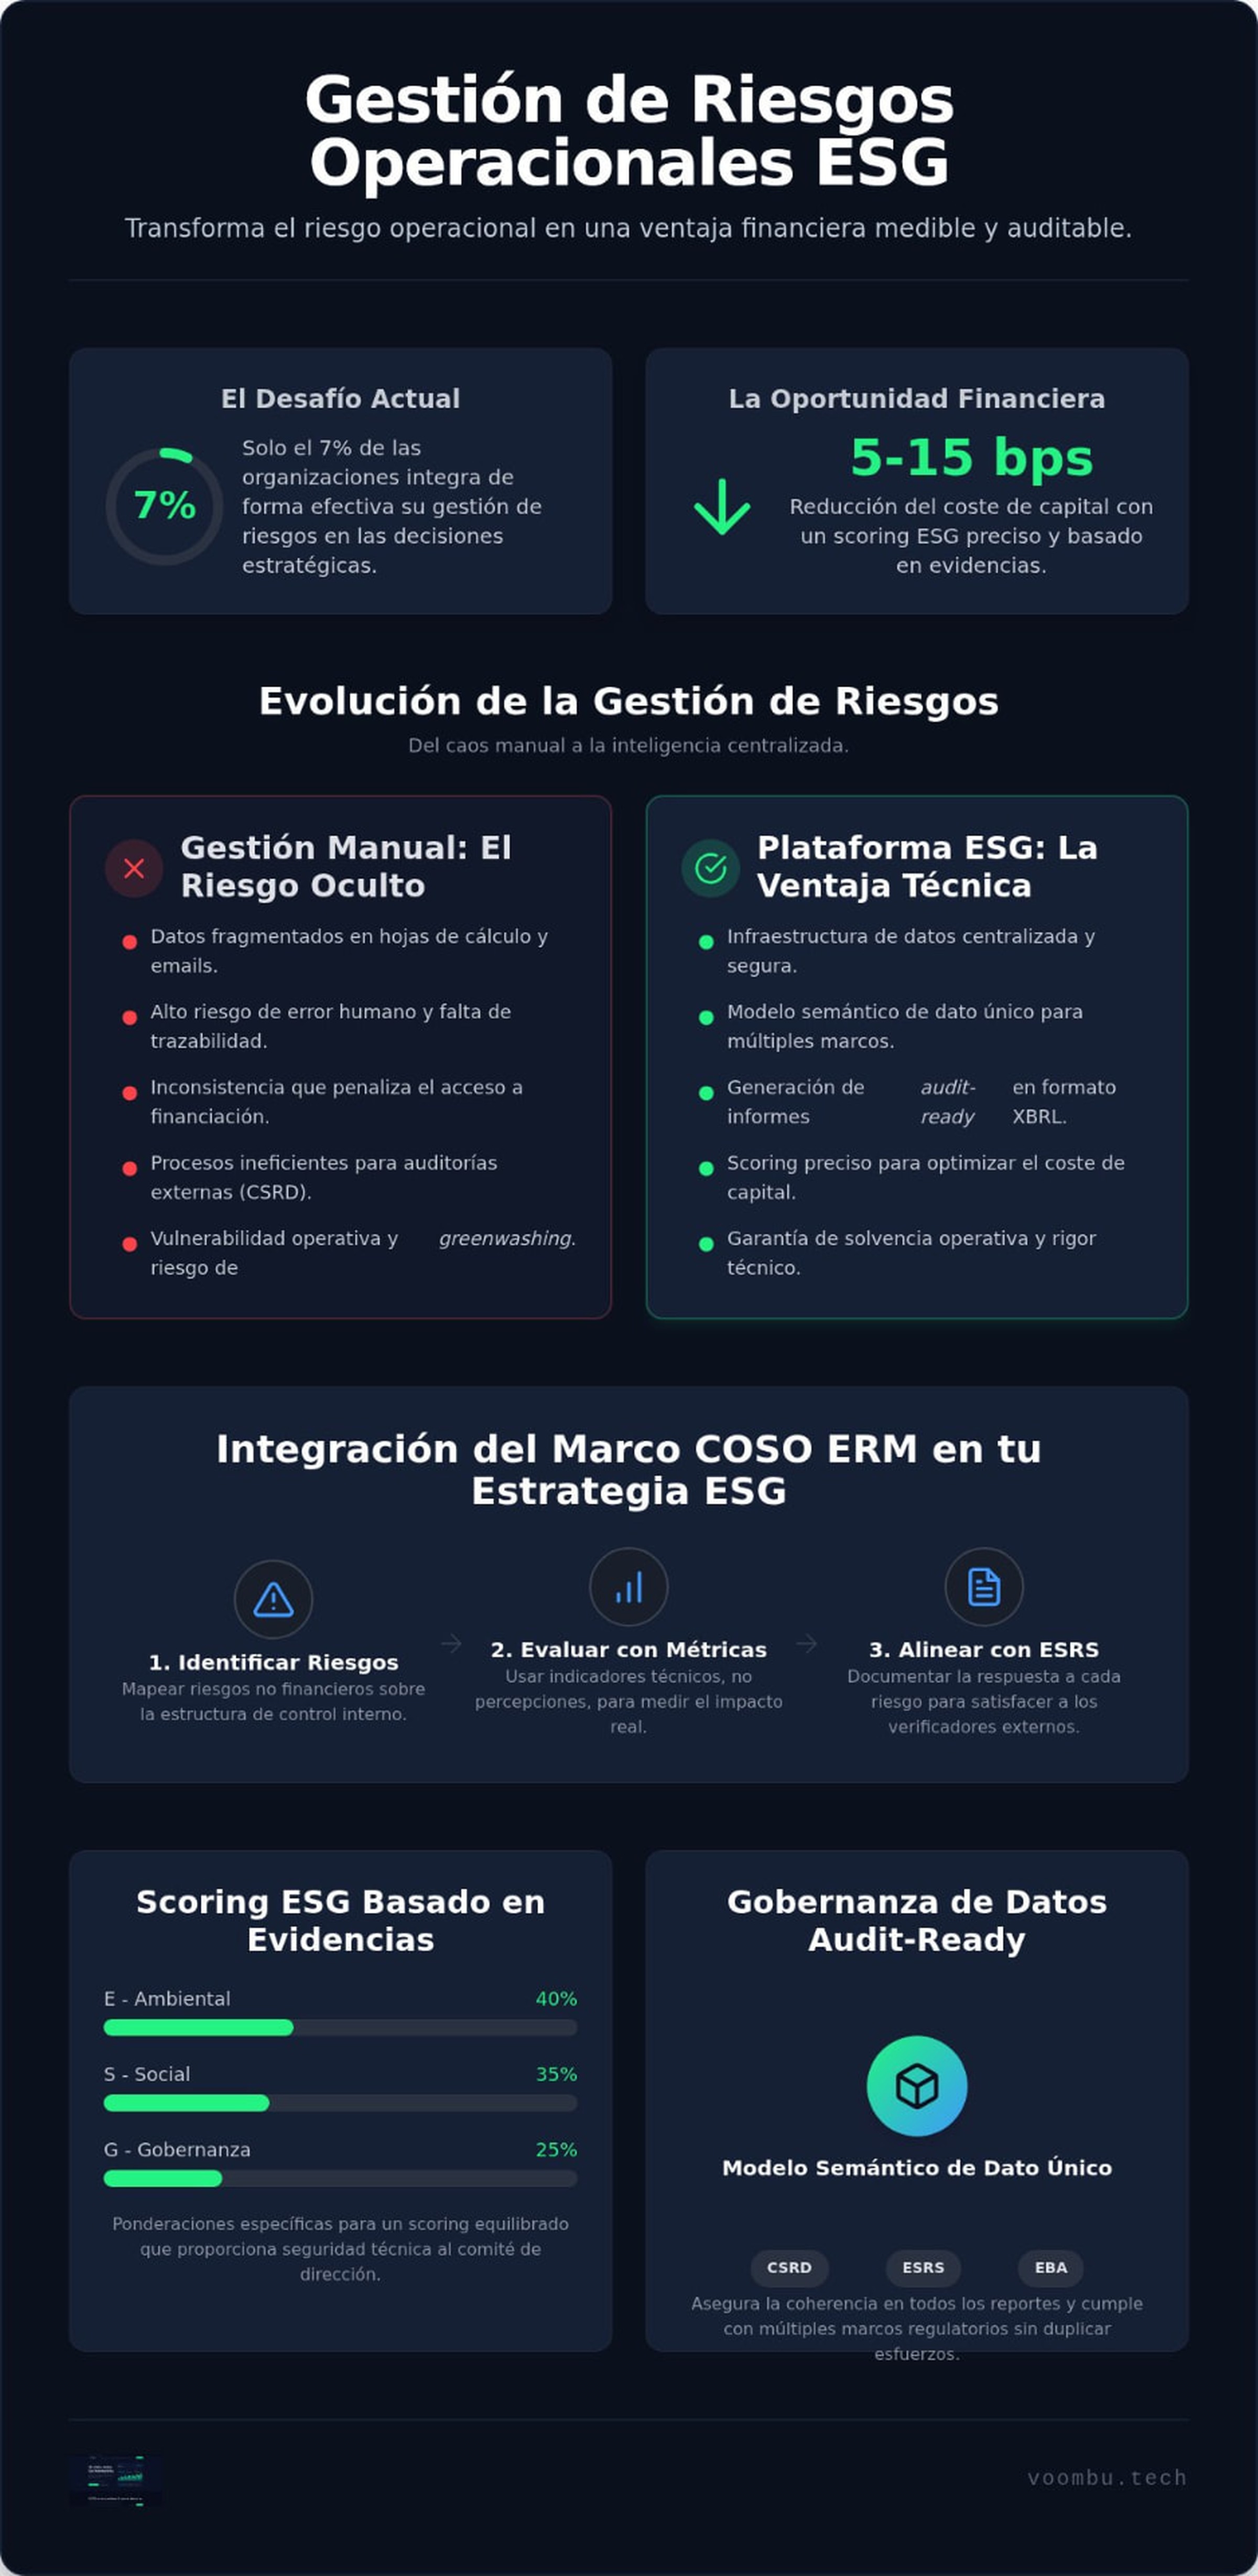
Frequently asked questions about ESG risk management
What is the difference between an ESG platform and traditional risk software?Traditional risk software stops at financial risks. An operational ESG risk management platform integrates non-financial risks — climate, supply chain, governance — into the same internal control framework (COSO ERM), so they stop being qualitative descriptions and become metrics affecting valuation and financing.
How does Voombu help prepare for verification under CSRD?
By automating data mapping to ESRS and GRI with complete traceability from source to report, and generating digital output in XBRL. The verifier receives a documented package, not a reconstruction: this shortens the audit and reduces the risk of qualifications.
Can supplier data be integrated for Scope 3?
Yes. The platform centralises value chain information — in VSME format, which is also the ceiling for what can be requested from mid-sized suppliers — and unifies it under a single data model instead of scattering it across spreadsheets.
What is XBRL and why does it matter?
It is the digital tagging language that allows supervisors and markets to process information automatically; CSRD requires it for sustainability reporting. Voombu generates it directly from the reported data, without manual conversions.
How does the ESG Score influence access to sustainable financing?
An evidence-based score improves the risk profile presented to the bank. In green and sustainability-linked loans, that profile can translate into an improvement of between 5 and 15 basis points in the cost of capital, depending on the starting bracket.
What weight do the E, S and G factors carry in the score?
40 % environmental, 35 % social and 25 % governance, in line with the methodologies of the main agencies adapted to the mid-market. The weighting prevents strong performance in one area from concealing shortcomings in another.
How long does platform implementation take?
It depends on the maturity of the starting data, but the platform is designed for the mid-market: with a single data model, the first traceable reports and dashboards are usually available in weeks, not quarters.
Does Voombu audit the reports?
No, and that is deliberate: Voombu is technological infrastructure, not an auditor or a consultancy. We prepare the data for an independent verifier to review — that separation is what makes the result credible.