
Article
Scope 3 carbon footprint calculation platform: a strategic guide for 2026
Of the three scopes of a corporate carbon footprint, the third is the hardest to calculate and the most significant. In most industrial, retail and financial services companies, Scope 3 accounts for between 70 % and 90 % of total emissions. It is also the scope European regulation requires companies to report under ESRS E1, the one investors scrutinise most closely, and the one large supply chains are beginning to request from suppliers. This guide explains what is measured, what tools are available, where spreadsheets fail and how to design a platform that stands up to audit.
Key takeaways Scope 3 covers 15 categories defined by the GHG Protocol, divided into upstream emissions (purchasing, transport, travel, waste) and downstream emissions (product use, end of life, investments). For most companies, Scope 3 represents the vast majority of the total footprint. Excluding it distorts the true picture of climate impact. ESRS E1 requires reporting of the Scope 3 categories found to be material following the double materiality assessment. Spreadsheets stop scaling when there are more than fifty active suppliers or operations in more than one country. Traceability breaks before the calculation does. A specialised platform must integrate with ERP and procurement, support spend-based and activity-based methodologies, and produce an audit trail the verifier can understand without difficulty. The reference standard is the GHG Protocol Corporate Value Chain (Scope 3) Standard, supplemented by sector guidance where available.
Table of contents
- What Scope 3 is and why it matters
- The 15 categories and how to prioritise them
- Why spreadsheets stop working
- Platform vs consultancy vs ERP: what each solves
- Methodology: spend-based, activity-based, hybrid
- Implementation roadmap
- How Voombu fits into this process
- Frequently asked questions
1. What Scope 3 is and why it matters
The GHG Protocol divides a company's greenhouse gas emissions into three scopes. Scope 1 covers direct emissions generated by owned facilities and vehicles. Scope 2 covers indirect emissions from purchased energy, mainly electricity. Scope 3 covers everything else: emissions occurring outside the operational boundary but as a consequence of the company's activity.
The reason Scope 3 dominates the conversation in 2026 is mathematical. In manufacturing, purchased materials and components have already emitted CO₂ before entering the factory. In retail, the end customer's use of the product emits far more than the store. In financial services, the investment portfolio emits several orders of magnitude more than the offices. Reporting only Scopes 1 and 2 leaves out the substantive part of the problem, and regulators and lenders already know this.
ESRS E1 formalises it. If climate change is material to the company (and it almost always is), reporting must include Scope 1, Scope 2 and significant Scope 3 categories. Limited assurance covers all three.
2. The 15 categories and how to prioritise them
The GHG Protocol Scope 3 standard defines fifteen categories. Eight are upstream (things purchased and brought into the company) and seven are downstream (things sold and what happens to them).
Upstream
- Purchased goods and services. The largest category for most companies. Covers everything acquired, from raw materials to cloud software.
- Capital goods. Machinery, buildings and facilities acquired.
- Fuel- and energy-related activities not included in Scope 1 or 2. For example, electricity transmission losses.
- Upstream transportation and distribution. Logistics for purchased products until they reach the company.
- Waste generated in operations. Treatment of waste generated by the activity.
- Business travel.
- Employee commuting.
- Upstream leased assets
Downstream 9. Downstream transportation and distribution. Logistics for products sold. 10. Processing of sold products. For companies selling intermediate products. 11. Use of sold products. The most relevant category for manufacturers of energy-consuming goods. 12. End-of-life treatment of sold products. 13. Downstream leased assets. 14. Franchises. 15. Investments. Critical for banks, funds and insurers. How to prioritise No company finds all fifteen categories material. The GHG Protocol recommends an initial relevance assessment to identify significant categories, and ESRS requires that assessment to be documented. Common criteria include estimated magnitude, associated risk, ability to influence and stakeholder requirements. The typical result is a list of three to six categories on which detailed calculation work is concentrated.
3. Why spreadsheets stop working
Almost every company starts calculating Scope 3 in Excel. That is reasonable: the tool is flexible, the initial cost is zero, and the first reporting cycle can be organised in one or two weeks with external consulting support. The problem is what happens in the second year.
What breaks first is not the calculation. It is traceability. When the auditor asks where the Category 1 emissions figure for a particular supplier comes from, the chain must be reconstructed: original invoice, emission factor applied, database consulted, consultation date and person who performed the calculation. In a spreadsheet with multiple tabs and authors, that chain gets lost.
The usual symptoms:
Different versions of the same data circulating by email. Emission factors updated in one tab but not in others. Changes to the consolidation boundary not reflected retrospectively in previous years. Inability to explain to the auditor why one year's figure differs from the previous year's. Time spent on reconciliation growing faster than the team. The spreadsheet is not a bad tool. It is designed for flexible analysis, not data governance. For a company with fifty suppliers, it works. For a company with three thousand, it does not.
4. Platform vs consultancy vs ERP: what each solves
Three options commonly overlap. Each solves a different part of the problem.
Consultancy alone A specialised firm calculates emissions for a complete reporting year, delivers a report and leaves. Useful for companies getting started, needing methodological support and in no hurry to industrialise the process. Medium-to-high cost per reporting cycle, recurring dependency and limited transfer of internal capability.
ERP sustainability module Major ERP systems (SAP, Oracle) have incorporated footprint calculation modules. For companies already operating within that ecosystem and having invested in its maturity, this is a coherent option. The obstacle is rigidity: methodology is preconfigured, emission factor updates depend on the vendor, and licensing and consultancy costs are significant.
Dedicated ESG platform Software built specifically to calculate, store and report emissions. It integrates with ERP and procurement systems, maintains an up-to-date emission factor database, supports several methodologies in parallel and produces an audit trail natively. Beyond a certain company size, it is the option that scales best and reduces recurring costs once implemented.
None of these options excludes the others. A common approach in mid-market companies is to hire a consultancy in the first year to establish the methodology, implement a platform from the second year onwards, and retain the consultancy for occasional audit support and complex cases.
Scope 3. The new financial axis of ESG
5. Methodology: spend-based, activity-based, hybrid
There are three ways to calculate Scope 3 emissions. Understanding them matters because they determine accuracy, cost and the conversation with the auditor.
Spend-based Multiplies monetary expenditure in a category by an emission factor expressed in kg CO₂ per euro. The usual source is environmentally extended input-output tables (EXIOBASE, USEEIO). It is quick to apply, requires no supplier data and covers 100 % of the boundary from day one. Accuracy is low: an efficient steel manufacturer and an inefficient one are averaged into the same factor.
Activity-based Multiplies the physical quantity consumed (kg of steel, litres of fuel, kilometres travelled) by a specific emission factor (kg CO₂ per kg of steel). Accuracy increases significantly, but it requires activity data and, in its most detailed form, primary data provided by the supplier.
Hybrid Recommended practice combines both. Material categories and significant suppliers are calculated using activity-based methods with primary data wherever possible. The remainder of the boundary is covered using spend-based calculations. The platform must allow these methods to coexist and trace which method was applied to each data point.
6. Implementation roadmap
Phase 1 — Inventory and relevance assessment (4–6 weeks) Map purchasing and sales flows, identify significant categories and document the climate materiality assessment. The deliverable is a prioritised list with justification.
Phase 2 — Calculation model design (4–6 weeks) Define which methodology applies to each category, which emission factor database is used (DEFRA, ADEME, IEA, ecoinvent, others), how the consolidation boundary is treated and how suppliers providing primary data are managed.
Phase 3 — Technical integration (6–10 weeks) Connect to ERP and procurement systems, load historical data, configure calculation rules, and define roles and permissions. This is the phase in which the platform demonstrates its value or its limitations.
Phase 4 — Initial calculation and validation (4–6 weeks) Process the first complete reporting year, perform internal validation, reconcile with the accounts and cross-check with departmental owners. Typical errors include double counting between categories, a consolidation boundary inconsistent with financial reporting and outdated emission factors.
Phase 5 — Reporting and audit (4–6 weeks) Generate the ESRS E1-aligned report, prepare the evidence dossier for the auditor, and develop the narrative connecting the figures with the transition plan. Limited assurance in the first year, followed by process improvement for subsequent years.
7. How Voombu fits into this process
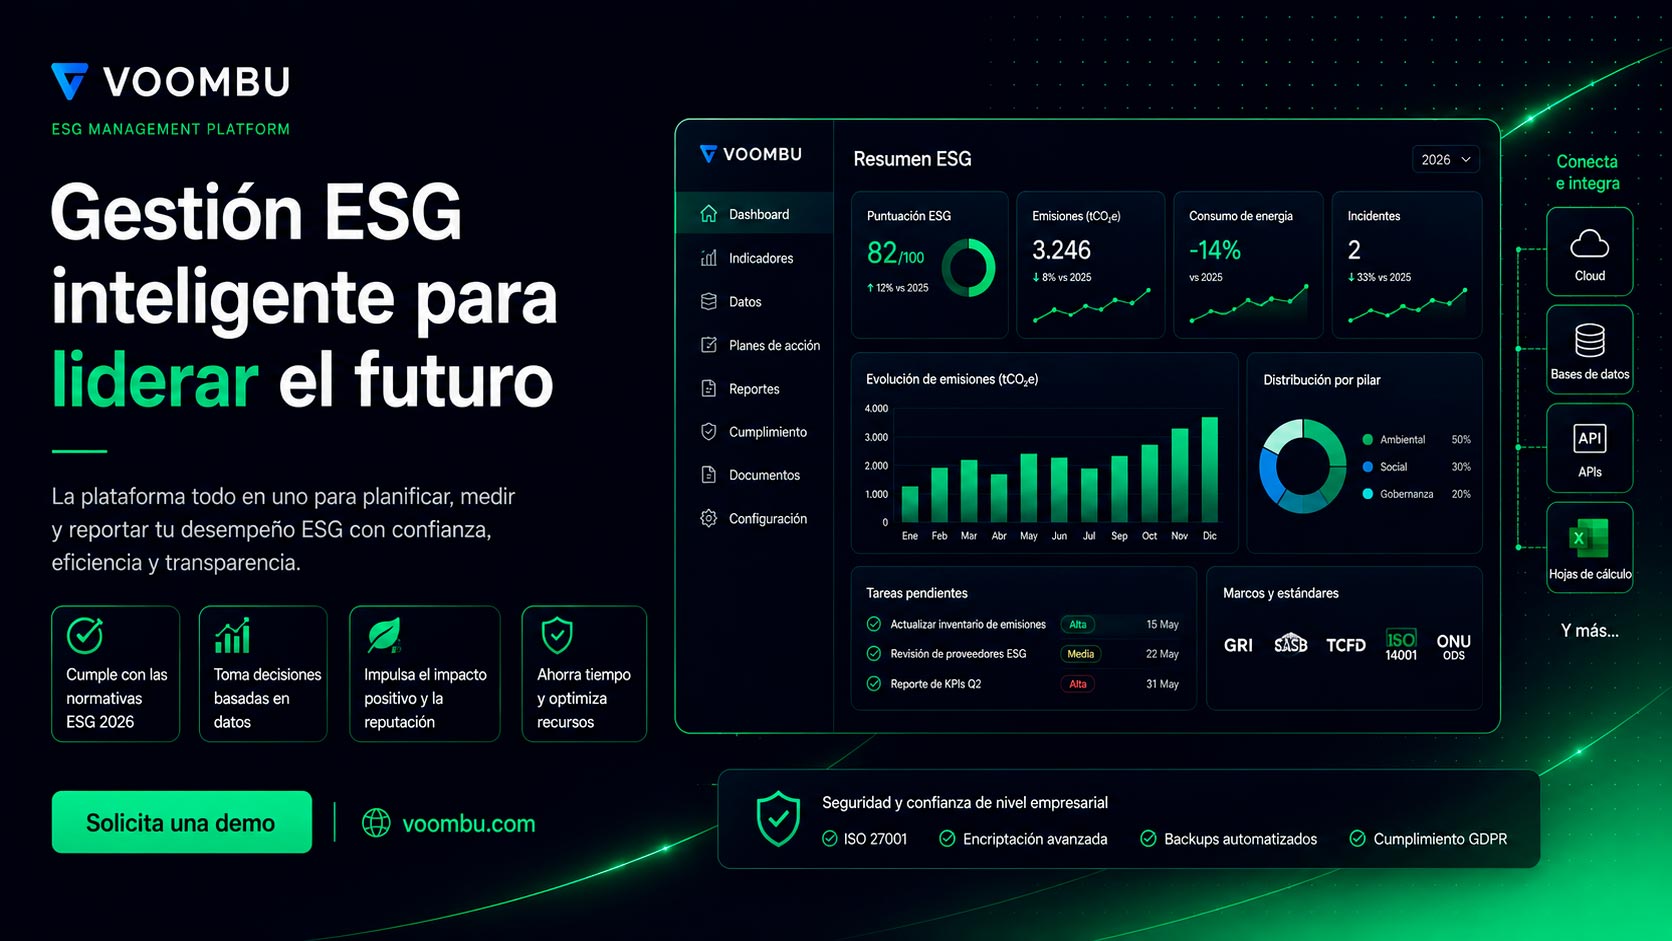
Voombu is an artificial intelligence-powered ESG management system. The carbon footprint module is one component of Automated Reporting, not a standalone tool.
Operational connectivity. Imports data from ERP, procurement systems and suppliers. The platform converts an invoice, delivery note or consumption record into an emissions figure by applying the configured methodology.
Native dual methodology. Supports spend-based and activity-based methods in parallel, with the ability to upload primary supplier data and replace approximate calculations with measured data. Traceability is recorded automatically.
Maintained factor database. Emission factors are updated centrally. The company does not depend on an Excel tab someone remembered to refresh.
Risk integration. The ESG risk management module (COSO ERM methodology) uses data from the footprint module to assess climate exposure, feed the dynamic ESG Score and display it on the executive dashboard.
Audit trail by design. Every data point has a source, date, applied method and owner. The auditor accesses the file without needing to reconstruct anything.
For consultancies providing footprint services to several clients, a multi-licence (MLC) option allows several companies to be managed from a shared infrastructure while maintaining data separation and visual customisation.
8. Frequently asked questions
How long does calculating Scope 3 for the first time take? For a mid-market company operating in one or two countries, between four and six months from project launch to an auditable report. The critical factor is not the tool, but access to procurement data and ERP maturity.
Can I start with spend-based calculations alone? Yes, and this is common practice in the first year. It covers 100 % of the boundary, provides an initial picture and identifies where investing in primary data is worthwhile. The second reporting cycle should move material categories to activity-based calculations.
What about suppliers unwilling to provide data? Most do not provide it in the first year. Calculations continue using spend-based methods or sector-average factors. The usual policy is to identify the ten or twenty most significant suppliers and work with them through annual data improvement campaigns. Large companies with influence in the supply chain achieve reasonable response rates by the third cycle.
Do I need to calculate all 15 categories? No. Only those found significant after the relevance assessment. For a typical industrial company, material categories are usually 1, 4, 6, 7, 11 and 12. For a financial institution, Category 15. Documentation of what is included and what is not excluded is audited just as carefully as the figures.
How do I connect footprint calculation with SBTi? The Science Based Targets initiative uses footprint data as the basis for setting reduction targets aligned with 1.5 °C. A platform that calculates the footprint annually using a consistent methodology enables the reduction pathway to be established and monitored. The SBTi target covers Scopes 1, 2 and, for companies with material Scope 3 emissions, the significant categories.
And with the EU Taxonomy? The Taxonomy requires reporting what proportion of economic activity falls within sustainable activities. GHG emissions are one of the technical criteria. The same platform should feed both reports, preventing them from being built in silos.
Is the footprint report public? Yes. It is published as part of mandatory sustainability reporting under CSRD, within the management report and with the corresponding XBRL tagging. The figure and methodology are visible to any stakeholder.
What happens if I make a mistake? If the error is detected before verification, it is corrected without consequence. If detected afterwards, the report is reissued with an explanatory note and the audit is reopened. The reputational damage is greater than the technical cost. That is why investing in cross-validation and internal controls is preferable to rushing reports.
Next steps Scope 3 is the part of the footprint that separates companies that report from those that understand their business. The difference is not methodological but organisational: it depends on having the data in a system, not in a file. Voombu supports mid-market companies and specialised consultancies in building that system. A 30-minute demo is usually enough to establish the starting point.