
Article
Software for auditable ESG data: a guide to ensuring compliance in 2026
Would you sign off the annual accounts using the same spreadsheet in which you currently consolidate your plants' electricity consumption? Almost nobody would say yes, yet this is still how sustainability is managed across much of the European mid-market: linked tabs, formulas somebody changed three years ago and no way to reconstruct where a particular figure came from. With the thresholds of Directive (EU) 2026/470 on the table and the new GRI 102 standard arriving, that leeway has disappeared. Software for auditable ESG data has stopped being a process improvement and become the place where your data governance lives.
What follows is quite specific: how to move from scattered information to traceable infrastructure that withstands external verification under CSRD and ESRS. Integrity from capture, metrics connected to internal control and reporting the verifier can review without requesting twenty emails with attachments. Ultimately, the objective is simple to state and difficult to achieve: every data point must be defensible before a third party.
Key Takeaways
- Manual processes are the leading source of issues during external verification. Replacing them with a controlled workflow changes the outcome, especially under the new Omnibus thresholds.
- End-to-end traceability: from the supplier's invoice to the published indicator, without gaps or retrospective reconstruction.
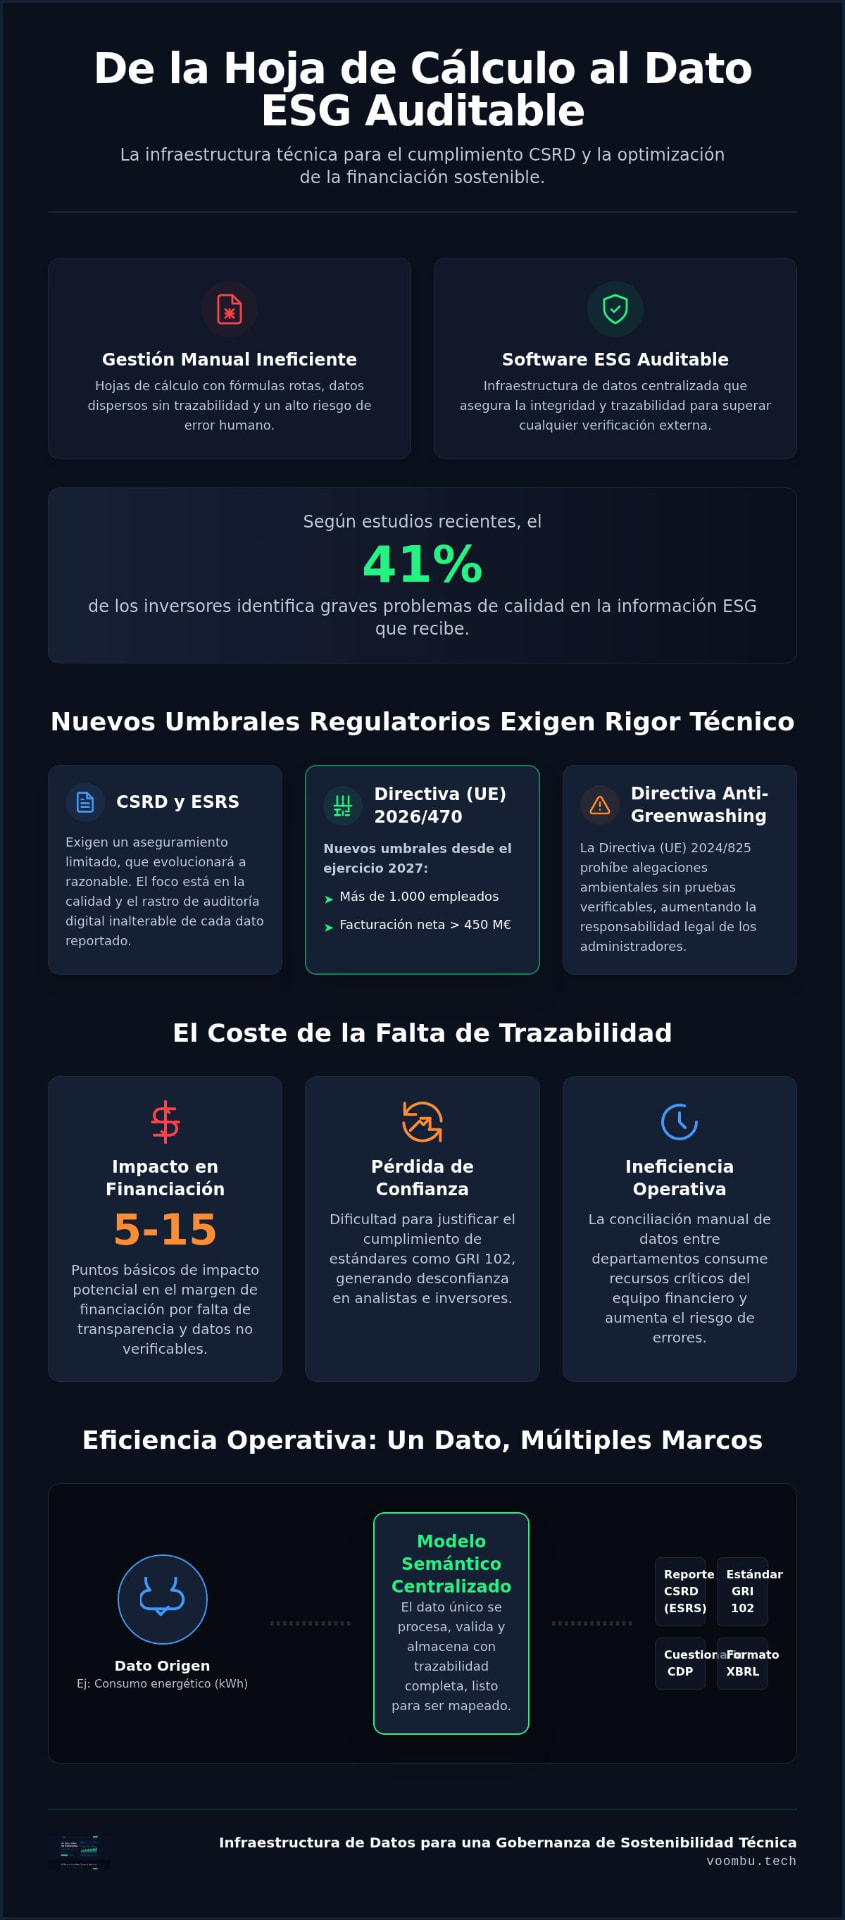
- A single semantic model prevents collecting the same data three times for CSRD, ESRS and GRI 102.
- XBRL tagging and an ESG Score with a documented methodology have consequences at the bank negotiating table: between 5 and 15 basis points on the lending margin.
Table of Contents
- The ESG audit challenge: Why are your spreadsheets no longer enough?
- Technical architecture: What defines software for auditable ESG data
- Intelligent regulatory mapping: Complying with CSRD and ESRS without duplicating effort
- Guaranteed traceability: From data source to XBRL reporting
- Voombu: Data infrastructure for technically grounded sustainability governance
The ESG audit challenge: Why are your spreadsheets no longer enough?
The problem with Excel is not Excel. It is that it remembers nothing. Six months later, nobody can tell you who changed the emission factor at the Zaragoza plant or why water consumption fell by 12% just before the report was finalised. Investors notice: 41% identified serious quality problems in the information they receive, according to April 2026 data. For a figure to be auditable, you must be able to explain where it comes from, the logic behind its calculation and who has handled it since. Without that, what you deliver is an estimate with attractive layout.
The regulatory pressure of CSRD and the ESRS standards
Directive (EU) 2026/470, known as Omnibus I, has changed the timetable and thresholds. It covers companies with more than 1,000 employees and net turnover exceeding 450 million euros, shifting the focus towards data quality for the 2027 financial year. That date deserves careful consideration, because those data are already being generated. Assurance starts at limited and moves towards reasonable, which in practice means a digital audit trail that nobody can edit afterwards. And when something goes wrong, responsibility does not remain with the sustainability department: it reaches the board of directors. That is why the Environmental, social, and corporate governance (ESG) framework must sit within the company's internal control system, not in a parallel process.
The cost of inadequate traceability in your company
Reconciling indicators manually across departments consumes hours of people who should be doing something else. And every manual handover adds another opportunity to make a claim you later cannot prove. Inadvertent greenwashing exists, and from 27 September 2026 it has specific consequences: Directive (EU) 2024/825 prohibits environmental claims without verifiable supporting evidence.
- Risk analysts lose trust, and recovering that trust costs considerably more than maintaining it.
- Substantiating compliance with the new GRI 102 climate change standard becomes an exercise in documentary archaeology.
- Financing simply becomes more expensive.
Banks already review information quality before granting a sustainability-linked loan. If you cannot demonstrate risk reduction using data that withstands scrutiny, you are unlikely to access the margin reductions typically ranging between 5 and 15 basis points.
Technical architecture: What defines software for auditable ESG data
There is a non-negotiable baseline, the same one you would apply to any financial system: encryption, two-factor authentication and an activity log nobody can rewrite. Then comes what really separates platforms from one another: native integration with your ERP. Without that connection, somebody ends up exporting a CSV, modifying it and uploading it again. The chain of custody breaks precisely there, and usually nobody notices until the auditor asks.
It is worth distinguishing between a database storing final figures and a dynamic model that allows the complete logical path of an indicator to be reconstructed. Only the latter supports an audit. Artificial intelligence, meanwhile, does useful work as an initial filter: detecting that a plant's consumption has tripled in a month, or that a social indicator has remained stuck at the same value for three quarters. Things the verifier will examine anyway. If you want to see how this level of control is structured, explore an ESG data governance platform designed around that principle.
The semantic model: One data point for every framework
“One data point, every framework” sounds like a slogan, but describes the idea well. A plant's natural gas consumption is entered once and the system automatically maps it to the indicators of GRI, CDP or the Corporate Sustainability Reporting Directive (CSRD), each with its own unit and format. Copying and pasting between templates ends, which is precisely where most inconsistencies creep in between the annual report and the questionnaire a client sent you in March.
Carbon footprint calculation with full traceability
Scopes 1 and 2 are manageable. Scope 3 is where everything becomes complicated, because you depend on third-party data you do not control. Whatever the scope, the requirement is the same: up-to-date emission factors from official sources, and a record of which version was applied at each site and when. The difference between a defensible calculation and one that is not often lies in an unglamorous detail: being able to attach the invoice, certificate or delivery note to the calculation itself. When the auditor asks, the evidence appears on the same screen, not in the inbox of somebody who no longer works for the company.
Intelligent regulatory mapping: Complying with CSRD and ESRS without duplicating effort
Reporting against several frameworks should not multiply the workload, yet that is exactly what happens when every questionnaire is tackled separately. The same team requests the same data from the same person three times a year, in three different formats. A regulatory mapping engine breaks that loop: a single data point is mapped to more than 16 international frameworks, including the EU Taxonomy and CSDDD.
Preconfigured ESRS templates help ensure nothing gets missed, and are updated when the rules change, as they inevitably do. The more interesting side effect is something else: automating mapping eliminates personal interpretations of each indicator. Two people on the same team stop reporting the same thing in two different ways, and that consistency is the first thing an external analyst values.
Automating ESRS and GRI indicators
If you operate outside Europe, interoperability between ESRS and GRI stops being a minor detail. What you need is for CSRD data points to be natively linked to their GRI equivalents, particularly the qualitative and narrative sections, which are hardest to systematise and consume the most time. A good system also performs real-time gap analysis and flags missing information before the period closes, not when the verifier is already inside conducting the review.
A double materiality matrix implemented through software
Double materiality on paper ages poorly: approved in January, by September it no longer reflects what concerns your stakeholders. Digitalising it resolves that problem. You assess impact and financial materiality using documented logic, launch integrated stakeholder surveys and the weighting recalculates automatically. The results feed directly into reporting, so you disclose what actually affects your business or its surroundings, rather than everything just in case.
Guaranteed traceability: From data source to XBRL reporting
In practice, traceability means something very simple: the verifier can follow the thread from the published figure back to the original invoice or meter reading without leaving the system. When that thread exists, the scope for accidental manipulation —the usual kind, rather than deliberate manipulation— falls almost to zero. The same workflow also generates publication-ready files meeting the requirements of the European Single Access Point (ESAP), so centralised evidence protects you against any subsequent information request as well.
Generating technical outputs: Word, PDF and XBRL
The PDF will remain what you send clients and publish on your website. But the European regulator wants XBRL, because it enables a machine to read and compare thousands of reports without opening them individually. EFRAG plans to deliver the updated ESRS taxonomy in December 2026. What matters is that tagging happens automatically, without manual intervention: the real risk is not getting one tag wrong, but having the narrative in the Word document say one thing while the XBRL metadata says another. That discrepancy is quickly detected and can invalidate the report before the competent authority.
The digital audit trail
The audit trail is the black box behind all this. Who entered the data, when, its previous value and what changed it. To serve any purpose, it must be genuinely immutable: user logs, strict version control and no possibility of deleting the history, even with administrator permissions.
Giving auditors controlled access within the tool itself significantly changes the pace of a review. Instead of requesting documents by email and waiting, the verifier logs in, sees the evidence attached to each indicator and moves forward. If you want to see how the data chain of custody works in a specific case, you can request a demo of our ESG governance platform. Less back-and-forth also means fewer billed hours of external assurance, a saving that is easy to calculate.
Voombu: Data infrastructure for technically grounded sustainability governance
Voombu was built for the European mid-market, which has been left in no man's land: too large to continue using spreadsheets, too small to build an internal reporting team like an IBEX-listed company. It is not a reporting tool with attractive templates, but the infrastructure layer that brings order where shared folders and goodwill used to suffice. Risk management follows the COSO ERM methodology, bringing ESG risks into the overall corporate matrix instead of leaving them in a separate Excel file.
ESG Score and Dashboard for the Executive Committee
The dynamic ESG Score weights the environmental pillar (E) at 40%, social (S) at 35% and governance (G) at 25%. It is worth being clear about what it is and is not: Voombu does not issue official ratings or conduct audits, but its methodology aligns with the criteria applied by agencies such as MSCI, Sustainalytics and EcoVadis. It helps identify gaps before a third party points them out. The dashboard is what the Committee appreciates, because members arrive at the meeting knowing what has changed since the previous one without reading forty pages.
Sustainable finance and optimising the cost of capital
All of this ends up in the income statement. A bank receiving traceable data aligned with the EU Taxonomy has less uncertainty to assess, and uncertainty is precisely what you pay for in the lending margin. We are talking about a range of 5 to 15 basis points which, on a sufficiently large loan, quickly becomes more than a minor detail. Voombu ensures every figure you show your financial institution has the supporting document behind it, so the risk analyst can validate your performance without calling you three times.
Towards ESG data infrastructure ready for technical scrutiny
Sustainability has adopted the precision demanded of financial reporting, and tools must support that transition. Software for auditable ESG data enables compliance with CSRD and ESRS standards without the team spending the entire first quarter reconciling figures. Full traceability, from primary evidence to XBRL tagging, removes the uncomfortable part of external verification and improves how banks assess your company.
Automating regulatory mapping and working with a live ESG Score frees your team to focus on what matters —decarbonisation strategy— instead of correcting transcription errors. And against the risk of greenwashing, rigorous data governance is the best available defence: not because it sounds good to say so, but because it is the only thing you can demonstrate.
Secure your compliance and request a Voombu demo to see with your own data what reporting prepared for an external audit looks like. It is the shortest route to regaining control over information that, by now, is no longer optional.
Frequently asked questions about ESG data governance
What is software for auditable ESG data, and how does it differ from a PDF report?
A PDF shows the result; software for auditable ESG data shows the journey. The practical difference is that the platform preserves an immutable record of every calculation and every modification, with documentary evidence linked to the corresponding figure. When the verifier wants to check where a number comes from, they log in and see it. With a PDF, somebody on your team has to start searching folders and old emails.
Is XBRL mandatory for sustainability reporting in 2026?
Digital tagging in XBRL is central to CSRD, although the mandatory implementation timetable has undergone several adjustments and deserves close monitoring. EFRAG expects to deliver the updated ESRS taxonomy in December 2026, and the formal tagging mandate has yet to be finalised. That said, with the European Single Access Point (ESAP) under way, preparing data in this format now saves you from redoing the work later.
How does ESG software help meet CSRD limited assurance requirements?
It provides precisely what limited assurance requires: a digital trail documenting the origin and logic of each indicator. This lets the auditor validate consistency without resorting to endless manual sampling. Centralising invoices, certificates and activity records and linking them to each data point shortens the review and, above all, increases the verifier's confidence in your internal controls, which ultimately determines how much effort they devote to you.
Can ESG software automatically calculate the Scope 3 carbon footprint?
Yes. These platforms incorporate calculation engines that apply official, up-to-date emission factors to operational data from your value chain, and automate supplier information collection by converting consumption or spending into tonnes of CO2 equivalent. The detail that makes this auditable: the system must document the methodology applied and retain a trail of the secondary data used in each Scope 3 category material to your business. Without that record, the calculation exists but does not stand up to third-party scrutiny.
What is the difference between ESG management software and sustainability consulting?
They are different things that usually coexist. Consulting helps you decide what to report and interpret the rules, usually at a specific point in the year. Software is permanent infrastructure: it captures, processes and stores those data with the rigour an external audit demands. Commissioning advice without first resolving the data layer leaves the same problem on the table in the following financial year.
How does ESG data software integrate with my company's current ERP?
Typically through APIs or specific connectors that extract financial and operational information directly from systems such as SAP, Oracle or Microsoft Dynamics. This eliminates manual entry and, more importantly, ensures the ESG figure matches the accounting record without anybody having to reconcile them afterwards. With a native connection, indicators such as energy consumption or spending per supplier update in your dashboard without human intervention.
What role does the COSO ERM methodology play in ESG risk management?
It brings sustainability risks into the same internal control structure as all other risks. A climate risk affecting raw material availability is an operational and financial risk, not a separate category, and treating it accordingly completely changes how it is prioritised. For the Executive Committee, the advantage is direct: it sees emerging threats on the same map as the others and decides using comparable criteria supported by evidence.
How does ESG data quality influence access to green loans?
Banks use your data quality as an indicator of the transaction's risk profile. Traceable, verified information reduces lender uncertainty, which translates into margin reductions typically ranging between 5 and 15 basis points. The reverse works equally well: without rigorous reporting, access to green loans becomes more difficult and the cost of capital rises purely because of perceived risk.